Categories
"machine reading"

Stylometry

Lexos

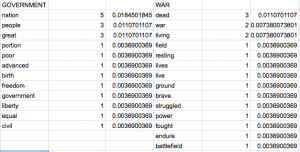
Recently, we have been analyzing the style of our corpora using Lexos and XML.  Right now, Lexos is one of my favorite tools that we have used.  Style is a very important part of song lyrics and I am glad that I have a better way to look at the style from song to song.  As I scrolled through the many tools that Lexos has, I was most interested in the statistics tab.  This gives me the amount of distinct terms, average term frequency, along with a few other stats.  The amount of distinct terms can tell me about how diverse the language used in American songs compared to the language used in songs from the UK.  I took the average of the amount of distant terms from the top 40 in each country and ended up seeing that the UK averages about 100 distinct terms per song while the USA averages 146 distinct terms per song.  When it comes to repetition in these songs, the UK average term frequency is 3.8 while the USA’s is 3.3.  This shows that the songs that are in the UK’s top 40 use more simple terms and do not repeat as often as those of the USA’s.  I did expect for one country to have more simple rhetoric and more repeating, but I sort of expected the USA’s top 40 to have these qualities.

When it comes to comparing the UK and USA top 40s to the Happy and Sad corpora, there are some interesting results.  Using the same statistics, we can compare the countries to the mood.  The group of happy songs has an average distinct term count of 108 per song.  This is closer to the UK top 40, which could be an indication that the UK top 40 has more “happy” lyrics than the USA’s top 40.  The happy songs also have an average term count of 3.2 which is closer to the USA’s top 40 amount of average word frequency.  This would lead me to believe that the USA’s top 40 is more “happy”.  Just as the UK top 40 matches up with the “happy” group of songs in terms of distinct terms and the USA top 40 matches up with the “happy” group of songs in terms of average terms frequency, the UK top 40 matches up with the “sad” group of songs in terms of distinct terms and the USA top 40 matches up with the “sad” group of songs in terms of average term frequency.

These statistics did not actually help me out too much, which is not what I was expecting.  I will continue to keep these findings in mind, however, because I think that they could become significant if I have some findings that support them.

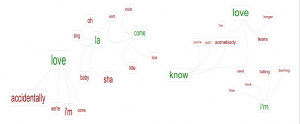
Another interesting tool on Lexos was the dendrograms.  Dendrograms are tree diagrams that show relationships between texts based on style.

Screen Shot 2016-04-20 at 11.11.54 AMScreen Shot 2016-04-20 at 11.13.42 AM


The dendrogram on the left is the USA top 40 dendrogram and the one on the right is the UK top 40. It looks like the USA top 40 has more songs that have a similar style as opposed to the UK top 40.  We can see that there are more songs that have the blue lines in the UK top 40.

XML oXygen

Using oXygen to ‘mark up’ texts has also been a useful way to look at text.  When I began marking up a poem by Henry Reed, it made me think of Jigsaw.  Jigsaw has a focus on entities and doing markup, we were basically picking out all of the entities.

Screen Shot 2016-04-20 at 11.02.05 AMScreen Shot 2016-04-20 at 11.27.27 AM

These screenshots are of my mark up of this poem.  It is a good way to simplify the poem and look at what it is talking about.  It is then easier to see what is being focused on and what metaphors are being used.

I think that I will continue to explore the tools on Lexos to analyze my text and I do not plan on using XML as much although it is useful.  I think that once I can get Jigsaw working as well, I will have a much better time analyzing the sentiments of the songs.  This along with style analysis will go a long way in teaching me about my corpus.

Can Computers Read Emotion?

Are computers able to read emotion?  This is a very important question that we deal with when talking about topic modeling and digital sentiment analysis.  What makes our brains, which are often compared to computers, able to read this emotion?

I do not think that computers can read emotions.  They can be taught, however, to associate certain words with certain emotions.  This is simply a computer reading an algorithm that is made for it to organize words in to categories.  As more and more people take to the internet to express sentiment, whether it be via blog or twitter, digital analysis of sentiment has become an increasingly hot topic.  Ramsey calls this a shift from a “cold arbiter of numerical facts” to a  “platform for social networking and self-expression.”  I think that this change in use of computers has definitely led to more efforts to have computers analyze emotions.

Topic Modeling and Emotion

Topic Modeling can play a big role when it comes to sentiment analysis via computer.  Topic Modeling searches for patterns in texts and tries to organize a larger text into the topics that it is about.  This can lead to discoveries about the sentiment of the text.  Topic Modeling works best when the person using it is familiar with the text that is being analyzed so that the results make more sense and can be interpreted correctly.  When we did our own Topic Modeling on the Gettysburg Address, we all came out with different results.  We all chose different words for each topic and this was because of the different backgrounds that we all had and ways that we associated words with each topic.

Screen Shot 2016-04-10 at 3.35.08 PM

This is a screen shot of the words that I chose that I thought represented both war and government in the Gettysburg address.  As I was doing this, I realized how hard it would be for a computer to perform this task accurately.  There are many words that cannot be associated with a certain topic without context.  The algorithms that need to be used to create a perfectly accurate topic model would need to be very in depth and I do not think that they would be able to account for everything especially not from culture to culture.  This is why the experimenter needs to be familiar with their text so that false results can be understood.

Ramsey says, “Such numbers are seldom meaningful without context, but they invite us into contexts that are possible only with digital tools.”  We are able to use the digital text analysis tools that we have to discover things like patterns and frequencies in texts, but I do not think that we are able to read emotions accurately through digital analysis.

Reflection

AN ANALYSIS OF LYRICS (So Far…)

The question that I initially had was regarding the differences between songs that are considered to be happy and songs that are considered to be sad.  Are there differences in the lyrics?  What makes lyrics “happy” or “sad”?

My first step was to create both happy and sad corpora.  I was able to utilize Spotify for this because they create playlists based off of mood.  It was very easy to find a playlist about being happy, while it was far more difficult to find a playlist of sad music.  This made me think about the social pressures for people to be happy.  I thought that this could be a signal that it is less socially acceptable for a person to be sad than it is to be.

Cleaning the lyrics was a bit of a chore, but was not as taxing as it could have been.  I googled all of the names of songs and copied and pasted them into word documents, when I copied and pasted them, there were many things that needed to be deleted such as brackets, chorus/verse indicators, and parenthesis.  There were also many instances in which the chorus was written once followed by a: [x2].  These needed to be removed and the chorus was copied so that the repeating of lyrics was accurate.  I think it was important to include the repeating of lyrics because this signifies that the words being said are important to the song.

Voyant

Voyant was an interesting program to work with because of the visuals that it can create for the viewer.  I found a majority of the visuals to be more cool to look at and less data based.  I think that the Link tool, the document trends, and the collocate tools were all very helpful to learning more about my texts.  The summary of the text was also helpful.  Screen Shot 2016-03-20 at 6.27.41 PM

AntConc

I did not get as much out of AntConc as I would have liked.  The main thing that I did with AntConc was look at word frequency,  I looked at the amount of pronouns in the different moods of music.  I recorded many more pronouns being used in the happy songs compared to the sad one.  There were some possessive pronouns the happy songs, while there were none in the sad songs.  This leads me to believe that there could be a sort of denial that is going on in the sad song lyrics, whereas the happy lyrics are more open.

Changes to the Project

I decided that I should broaden my corpus or create a corpus to compare my first one to.  I took the top 40 songs from both the US and the UK and created a corpus of the songs.  So far, the main thing that I have looked at in these collections of lyrics is word frequency.  The most frequent words in both US and UK top 40s include “I’m” and “know”, which are also frequent words in the collection of sad songs.  “I’m” is a word that is a frequently used in all of the corpora.  I think that this could show us that whether happy or sad, US or UK, there is always an undertone of individualism and maybe narcissism

.  US top 40 wordle


My New Question:  What role do the lyrics to a song play in making a song “Happy” or “Sad” and how can we take what we learn about lyrics and apply it to the Top 40 lists of both the USA and United Kingdom?

Remaining Tasks as of now:

  • Figure out how to work Poemage to analyze rhyme scheme.
  • Work on Jigsaw analysis of sentiment with a reference corpus