Throughout the past two weeks our class has focused heavily on exploring texts on a macro and micro level. With the use of different digital platforms, we have been able to explore our corpus’s in a more complex and sophisticated manner than ever before. Part of the reason why this exploration was so difficult and hard to interpret is because all of these platforms are very statistical and numerical rather than user friendly like Voyant for example. So, the first step in really understanding what it was we were looking at, was adapting ourselves to the complexity of what we were looking at visually. Throughout the entire process though it was important to remember that our research was not computer driven, but instead the computer was the tool used to drive us to answer or answers per say. Pierazzo says, “The challenge is therefore to select those limits that allow a model which is adequate to the scholarly purpose for which it has been created (Pierazzo).” And the scholarly purpose is for us to be able to create a bigger picture of the text and inferences, but it is our job to decide how we use these digital platforms to do so. By using these platforms, we are able to look at our texts either zoomed in or zoomed out, in order to ultimately support our interpretations.
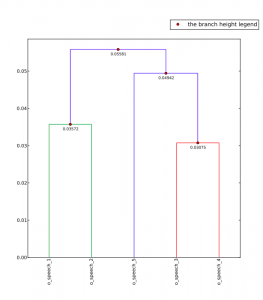
When first looking at the dendrograms in order to focus on the similarities and differences between the political speeches I was using, I was frazzled to say the least. So I started off by just inputting Obama’s speeches and seeing what I could come up with. A score of 1 indicates tight, distinct clusters, where numbers closer to 0 represent overlapping clusters. This is used to show how similar each speech is to all of the speeches as a whole. As we can see below most values are much closer to 0 indicating that the speeches might have some overlapping and similar word uses.
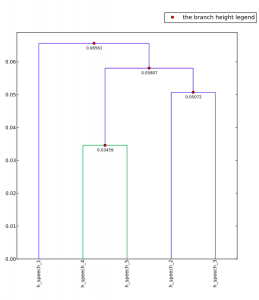
I then went on to look at Hillary’s speeches in the dendrogram. The values on her numbers tended to be around the .05 mark, but over all higher than Obama. This might suggest to me that Hillary’s speeches are more different in her word use and styleometry.
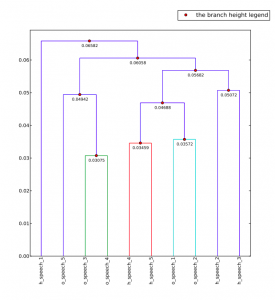
When putting in all of Hillary and Obama’s speeches, I got even more complex results. The use of different colors and high numbers suggests to me that essentially their speeches are pretty different and don’t have much in common. My results were not really that interesting because they are pretty predictable. It is only natural that Hillary’s speeches would differ from Obama’s because they are different people who speak differently. Although, the fact that Obama’s speeches were seemingly more similar, could influence the way that he imposes and reiterates his ideas to the American people as oppose to Hillary and the more severe difference in her speeches.
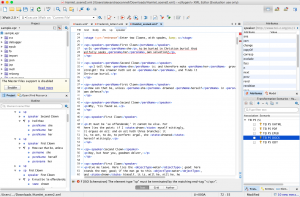
In the continuance of our exploration in text analysis we moved on to the use of Oxygen, which was only more complicated of a notion to me than using dendograms. With oxygen we are looking at each word closely and actually telling the computer how to interpret these texts. This is important because it further shows how the computer programs are only a tool to further our understanding rather than the entire purpose of our corpus. For example, I labeled below each time “Ophelia” was referred to as her name or as “her, she, etc.” to understand how people view her.
Pierazzo says “It is the argument of this article that editions as we know them from print culture are substantially different from the ones we find in a digital medium (Pierazzo).” And therefore, it was essential that we used these prints to extract a greater meaning and form a deeper understanding of this text as well as our own corpus. Pierazzo also states that it is difficulty choose “which features of the primary source are we to reproduce in order to be sure that we are following ‘best practice’(Pierazzo).” This also goes to show how arbitrary of a practice this is because the computer is a tool that we are using rather than the computer just giving us all the answers. Moreover, in using all these digital platforms I was able to see all of their flaws as well as all that they have to offer.
One reply on “Machine Reading”
So a dendrogram is a visualization of the most frequently used words in texts and how similar those lists are for the different works. You could think of it as shared traits, like in a family tree. The closer the “branches” are related then the closer related are the texts.
It might be interesting to run a z value analysis–which are the most distinctive words?
Good job though!